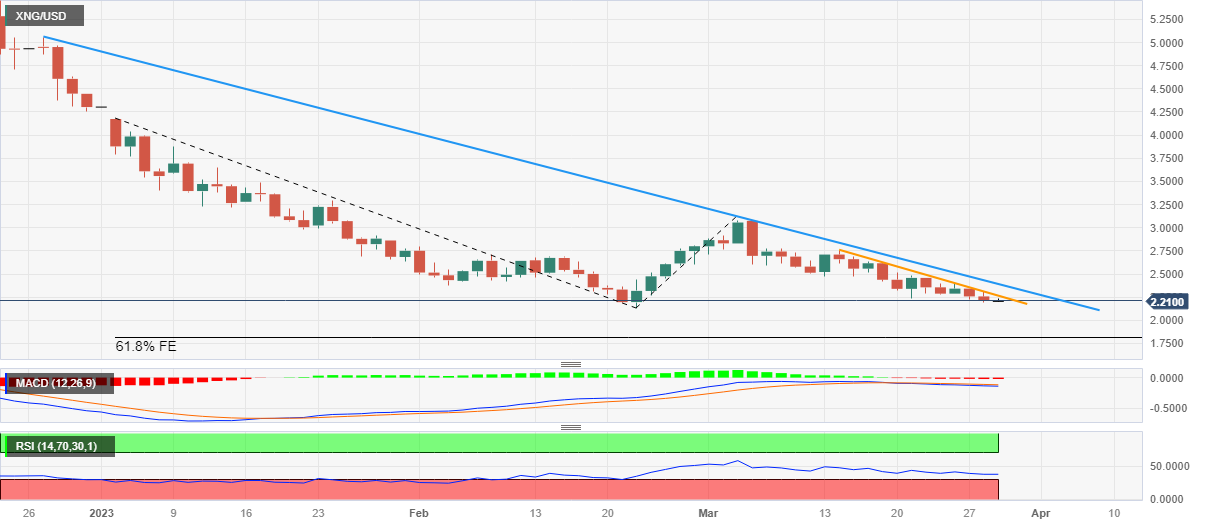
- Natural fades the previous day’s corrective bounce off five-week low.
- Sustained trading below two-week-old descending trend line favors bears.
- Yearly low, early July 2020 top can prod XNG/USD bears before directing them to 61.8% Fibonacci Expansion.
- Bulls need validation from a downward-sloping resistance line from late December 2022.
Natural Gas (XNG/USD) holds lower ground near $2.20 as bears poke the Year-To-Date (YTD) low marked in February. In doing so, the energy quote remains sluggish after declining in the last two consecutive days.
The XNG/USD bears cheer the sustained trading below a fortnight-long descending resistance line, around $2.27 by the press time, amid bearish MACD signals and an absence of oversold RSI (14).
As a result, the Natural Gas price appears well-set to slip beneath the yearly low of $2.13, which in turn highlights the $2.00 psychological magnet.
However, the early July 2020 high surrounding $1.97 and the 61.8% Fibonacci Expansion (FE) of its moves during early January-March 2023, around $1.80, could challenge the Natural Gas bears afterward, amid a likely oversold RSI line around then.
On the contrary, an upside break of the stated immediate resistance line, close to $2.27, isn’t an open invitation to the Natural Gas buyers as another downward-sloping trend line from the year’s start, near $2.40 at the latest, acts as an additional check for the XNG/USD bulls.
Should the quote manages to remain firmer past $2.40, the odds of witnessing a rally toward the mid-March high of $2.75 can’t be ruled out.
Natural Gas Price: Daily chart


