
- Silver attracts fresh buying on Friday and steadily moves back closer to the weekly peak.
- The technical setup supports prospects for the emergence of fresh selling at higher levels.
- A sustained move beyond the $22.00 mark is needed to negate the near-term bearish bias.
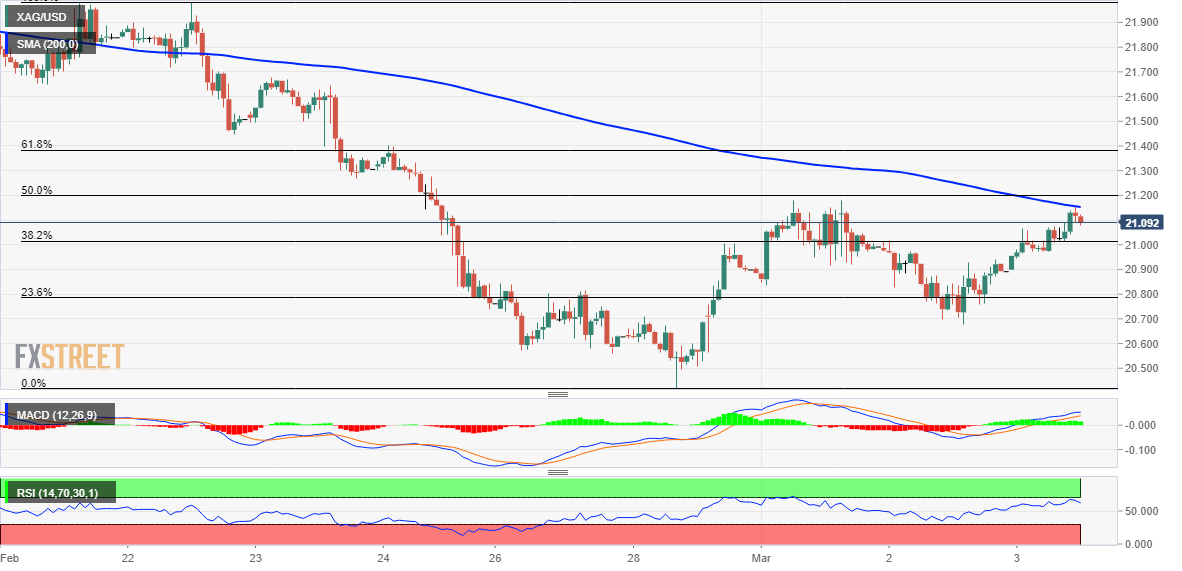
Silver regains positive traction on Friday and climbs back to the top end of its weekly trading range, around the $21.15-$21.20 region during the mid-European session. Bulls now await a sustained strength beyond the 200-hour SMA before positioning for any further intraday appreciating move.
Any subsequent move up, however, is likely to confront stiff resistance just ahead of the mid-$21.00s, marking the 23.6% Fibonacci retracement level of the recent pullback from the $24.65 zone, or a multi-month top touched in February. A sustained strength, however, might trigger a short-covering move and lift the XAG/USD further towards the 38.2% Fibo. level, around the $22.00 round-figure mark.
That said, technical indicators on the daily chart are still holding deep in bearish territory and have also recovered from the oversold zone. This, in turn, supports prospects for the emergence of fresh selling at higher levels and suggests that the ongoing recovery move from the YTD low, around the $20.40 region set earlier this week, runs the risk of fizzling out rather quickly near the aforementioned handle.
On the flip side, the $20.70-$20.60 zone seems to protect the immediate downside ahead of the $20.40 level. Failure to defend the said support levels will be seen as a fresh trigger for bearish traders and pave the way for further losses. The XAG/USD could then turn vulnerable to weaken further below the $20.00 psychological mark and test the next relevant support near the $19.75-$19.70 region.
The downward trajectory could get extended towards the $19.20-$19.15 intermediate support en route to the $19.00 round figure before the XAG/USD eventually drops to the $18.25-$18.20 strong horizontal support.
Silver 1-hour chart
Key levels to watch
XAG/USD
| OVERVIEW | |
|---|---|
| Today last price | 21.12 |
| Today Daily Change | 0.20 |
| Today Daily Change % | 0.96 |
| Today daily open | 20.92 |
| TRENDS | |
|---|---|
| Daily SMA20 | 21.63 |
| Daily SMA50 | 22.91 |
| Daily SMA100 | 22.09 |
| Daily SMA200 | 20.99 |
| LEVELS | |
|---|---|
| Previous Daily High | 21.02 |
| Previous Daily Low | 20.68 |
| Previous Weekly High | 21.98 |
| Previous Weekly Low | 20.74 |
| Previous Monthly High | 24.64 |
| Previous Monthly Low | 20.42 |
| Daily Fibonacci 38.2% | 20.81 |
| Daily Fibonacci 61.8% | 20.89 |
| Daily Pivot Point S1 | 20.73 |
| Daily Pivot Point S2 | 20.53 |
| Daily Pivot Point S3 | 20.38 |
| Daily Pivot Point R1 | 21.07 |
| Daily Pivot Point R2 | 21.21 |
| Daily Pivot Point R3 | 21.41 |