- Silver stages a modest recovery from a near one-month low, albeit lacks follow-through.
- The technical setup favours bearish traders and supports prospects for additional losses.
- A sustained break below the $23.70 confluence is needed to reaffirm the negative bias.
Silver (XAG/USD) gains some positive traction on Tuesday and for now, seems to have snapped a six-day losing streak to a near one-month low touched the previous day. The white metal maintains its bid tone through the first half of the European session, though seems to struggle to capitalize on the momentum beyond the $23.00 round figure.
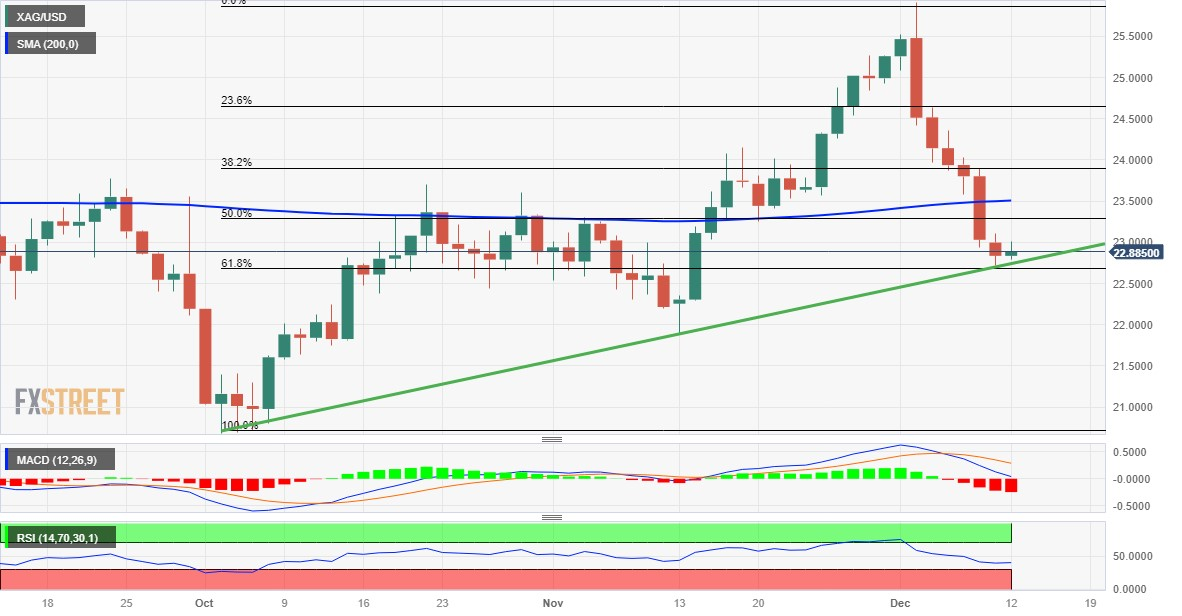
From a technical perspective, the recent pullback from the vicinity of the $26.00 mark, or the highest level since May touched earlier this month stalls near the $22.70 confluence support. The said area comprises the 61.8% Fibonacci retracement level of the October-December rally and a multi-month-old ascending trend line, which should now act as a key pivotal point for short-term traders.
Meanwhile, oscillators on the daily chart have just started drifting into negative territory and favours bearish traders. That said, it will still be prudent to wait for a convincing breakdown through the confluence support before positioning for any further losses. The XAG/USD might then slide to the $22.20-$22.15 intermediate support en route to sub-$22.00 levels, or the November swing low.
On the flip side, the $23.30 static resistance could cap any meaningful recovery ahead of the $23.55-$23.60 supply zone. That said, a sustained strength beyond could trigger a short-covering rally and lift the XAG/USD beyond the $24.00 mark, towards the next relevant hurdle near the $24.20-$24.25 region. The momentum could get extended further towards reclaiming the $25.00 psychological mark.
Silver daily chart
Technical levels to watch
XAG/USD
| OVERVIEW | |
|---|---|
| Today last price | 22.88 |
| Today Daily Change | 0.04 |
| Today Daily Change % | 0.18 |
| Today daily open | 22.84 |
| TRENDS | |
|---|---|
| Daily SMA20 | 24.03 |
| Daily SMA50 | 23.11 |
| Daily SMA100 | 23.24 |
| Daily SMA200 | 23.5 |
| LEVELS | |
|---|---|
| Previous Daily High | 23.1 |
| Previous Daily Low | 22.72 |
| Previous Weekly High | 25.92 |
| Previous Weekly Low | 22.94 |
| Previous Monthly High | 25.27 |
| Previous Monthly Low | 21.88 |
| Daily Fibonacci 38.2% | 22.87 |
| Daily Fibonacci 61.8% | 22.96 |
| Daily Pivot Point S1 | 22.67 |
| Daily Pivot Point S2 | 22.51 |
| Daily Pivot Point S3 | 22.29 |
| Daily Pivot Point R1 | 23.05 |
| Daily Pivot Point R2 | 23.27 |
| Daily Pivot Point R3 | 23.43 |